Overview
This article serves as a comprehensive guide for sales leaders aiming to transform raw data into meaningful information, underscoring the critical role this process plays in effective decision-making and operational efficiency. It delineates essential steps, including:
- Defining objectives
- Collecting relevant data
- Cleaning and organizing it
- Employing analytical tools
Notably, it points out that a staggering 90% of organizational information often goes unused, signifying a substantial opportunity for enhancing data utilization.
Introduction
Transforming raw data into actionable insights represents a critical challenge for sales leaders navigating today’s data-driven landscape. This ability not only enhances decision-making but also drives operational efficiency and competitive advantage. Alarmingly, 90% of organizational data remains unused.
How can sales teams effectively harness this potential to inform their strategies and improve performance? This guide explores essential steps and tools necessary to convert data into valuable information, empowering sales leaders to unlock insights that can significantly impact their success.
Define Data and Information
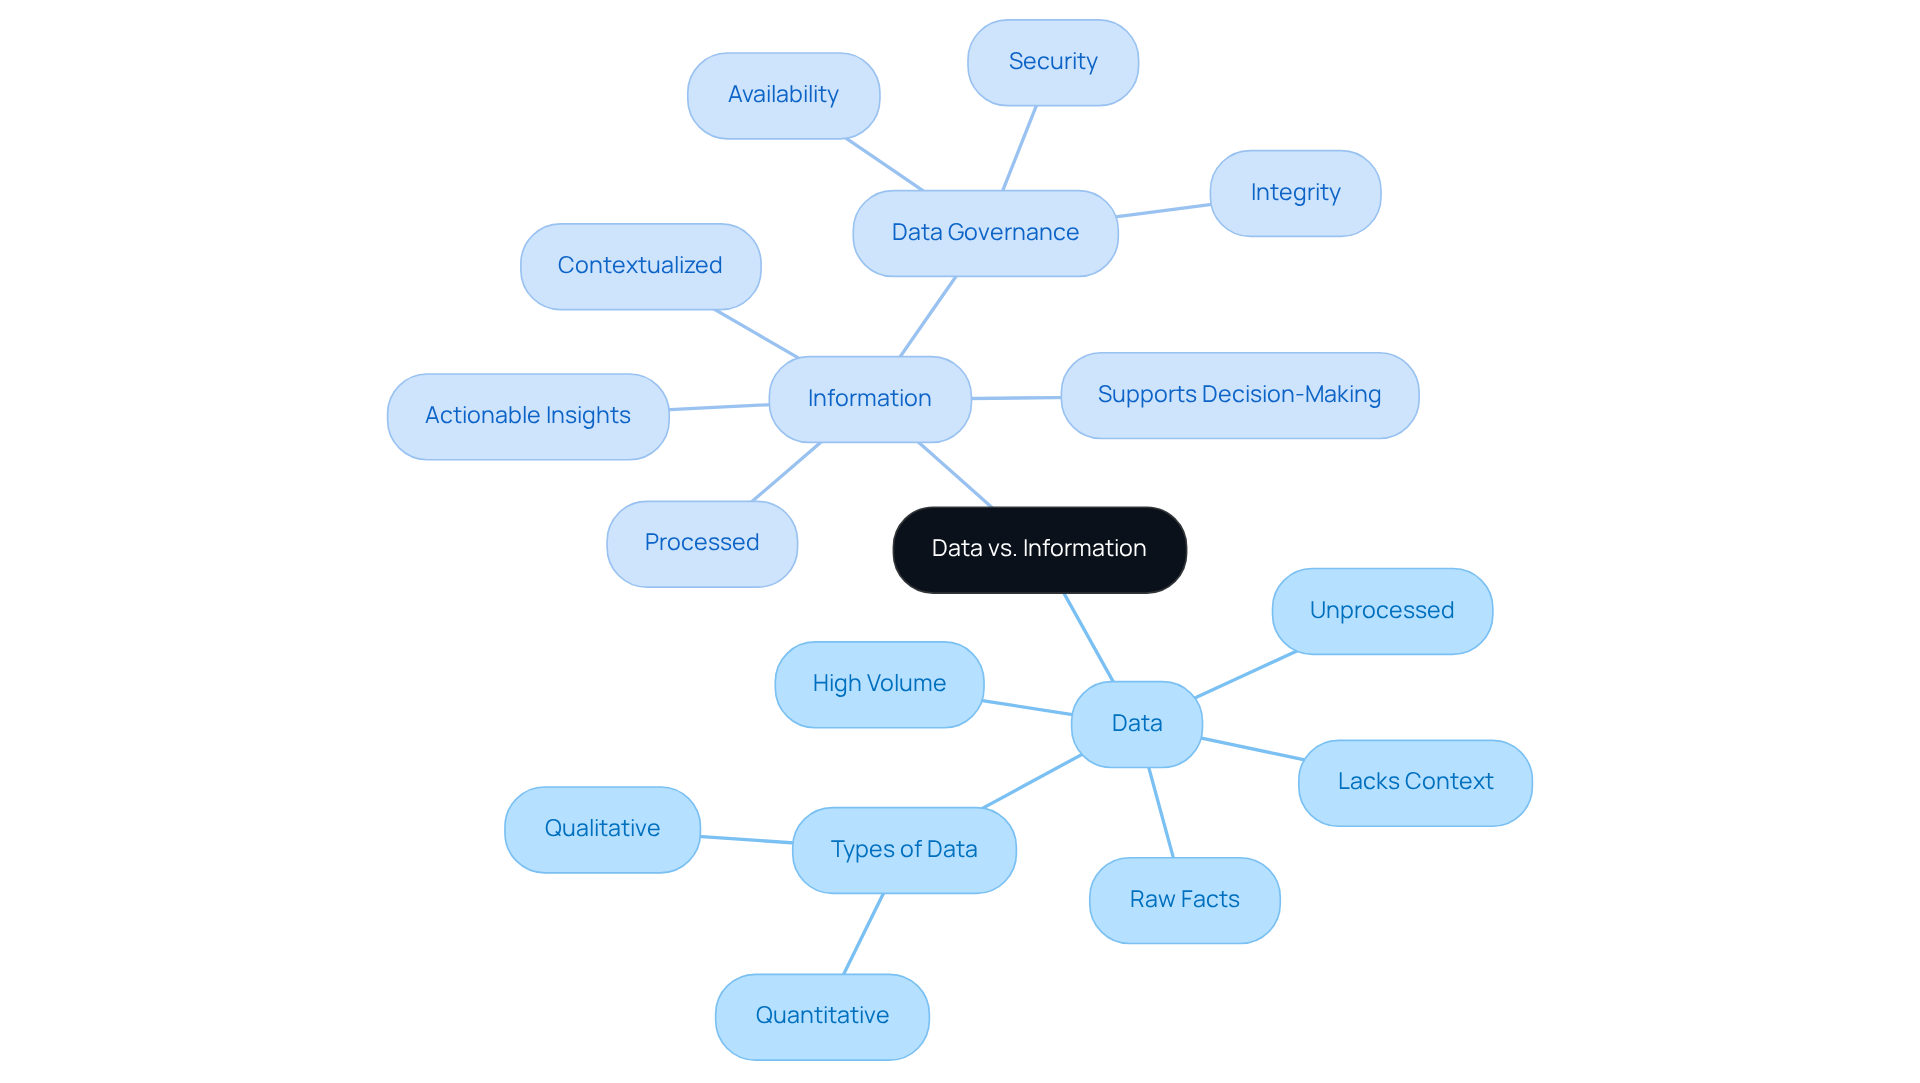
Data consists of raw, unprocessed facts and figures—numbers, dates, and strings of text. On its own, it lacks context and meaning. In contrast, turning data into information refers to material that has been processed, organized, or structured to provide context and meaning. For instance, while a compilation of revenue figures serves as raw input, a report summarizing those figures to illustrate trends over time constitutes knowledge. Understanding this distinction is crucial for sales leaders, as it shapes their approach to .
Turning data into information is essential for generating reliable insights, which are foundational for effective decision-making and operational efficiency. A survey of 552 full-time U.S. business decision-makers revealed that 77% of analytics professionals prioritize evidence-based decision-making. This statistic underscores the importance of turning data into information in order to derive meaningful insights. Alarmingly, 90% of organizational information often remains unused, representing a significant untapped resource that could be utilized for turning data into information and generating actionable insights.
Consider practical examples: businesses that analyze revenue information over time can identify growth trends and adapt strategies accordingly. For instance, a commercial group that correlates revenue figures with marketing expenditures can assess the impact of promotions and refine future campaigns.
As Gartner's research predicts, by 2025, nearly all data-driven decisions will incorporate some level of automation, propelled by AI and decision intelligence. This evolution emphasizes the necessity for sales leaders not only to comprehend information but also to manage it effectively to enhance their decision-making capabilities. In this context, recognizing that information serves as the foundation while knowledge represents the actionable understanding derived from it is vital for gaining a competitive edge.

Steps to Transform Data into Information
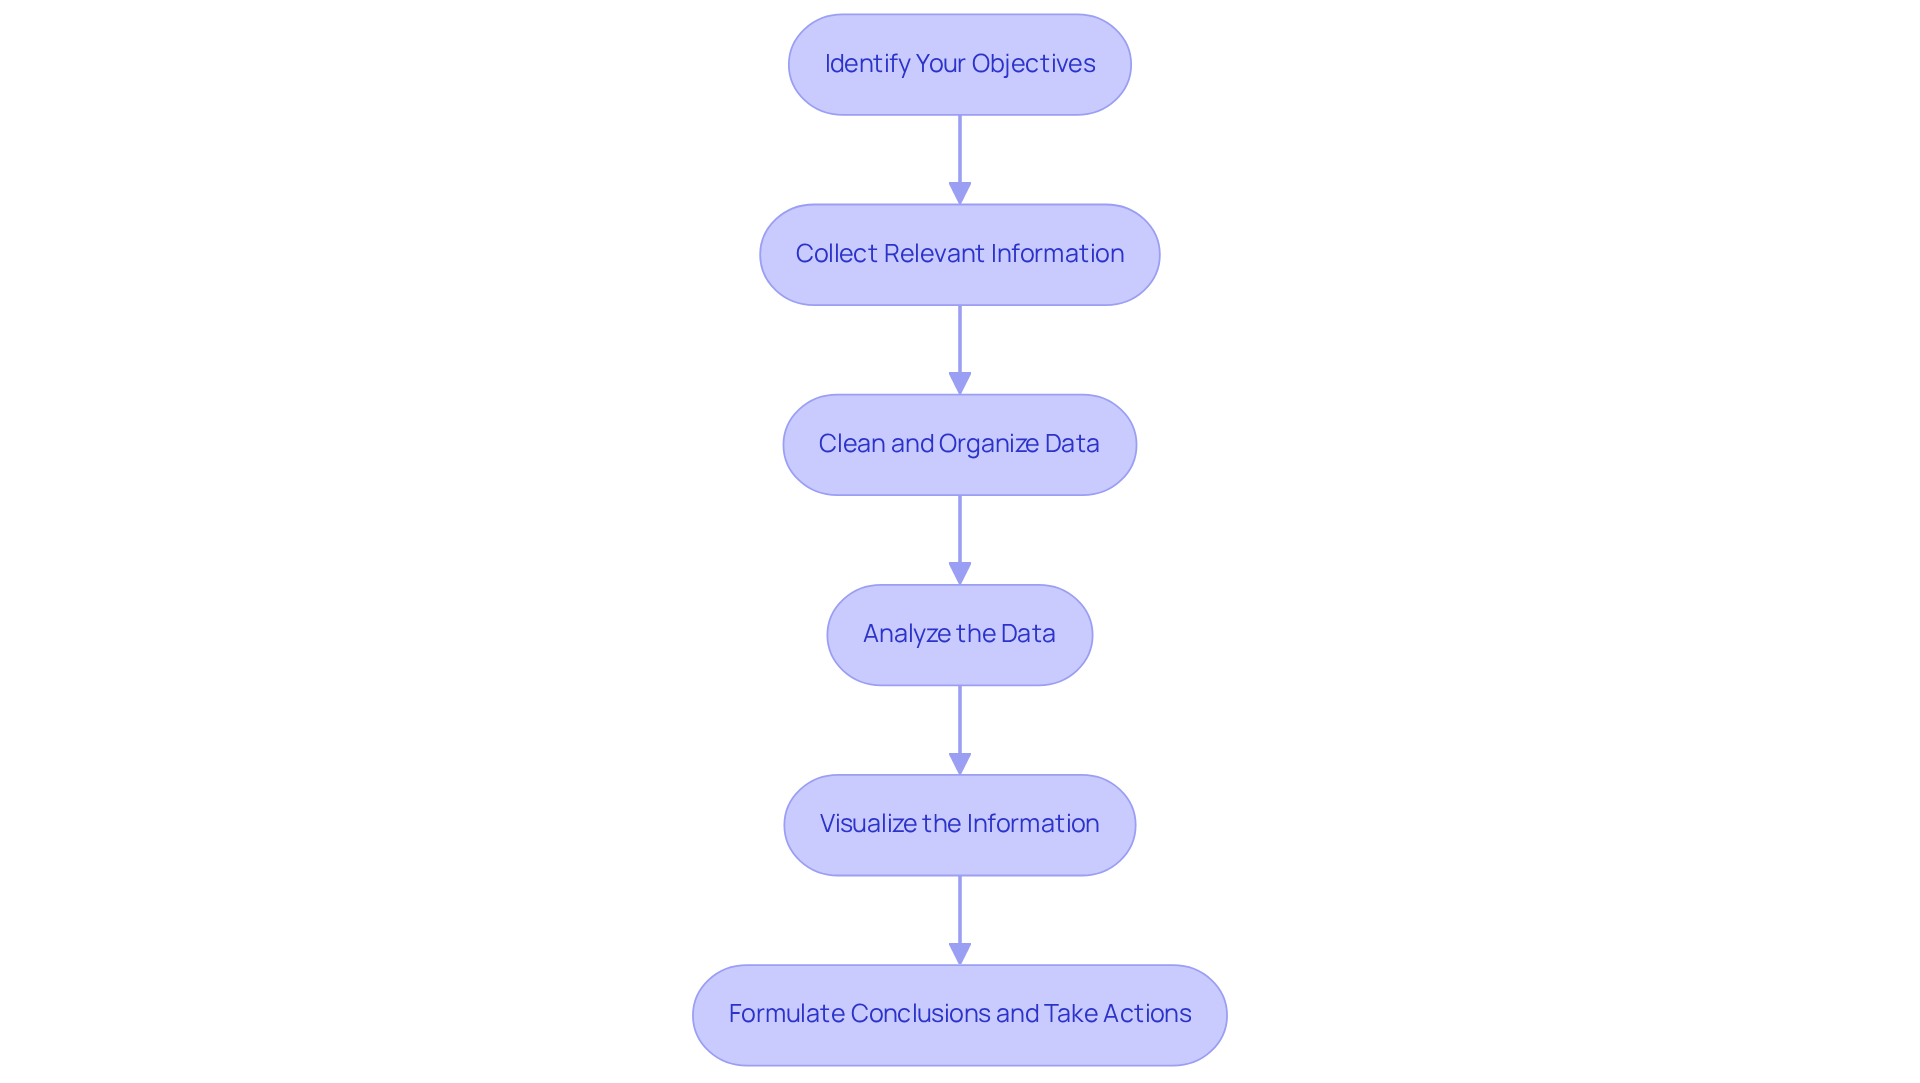
- Identify Your Objectives: Clearly define your goals for information utilization. Are you aiming to enhance revenue forecasting, gain insights into customer behavior, or streamline your selling processes? Establishing clear objectives is the first step toward effective decision-making by turning data into information.
- Collect Relevant Information: Aggregate data from diverse sources—CRM systems, sales reports, and market research. Ensure that this information aligns with your defined objectives to maximize its relevance and utility in your analysis.
- Clean and Organize Data: Eliminate duplicates, rectify errors, and standardize formats to maintain high data quality. This foundational step is essential for turning data into information, which ensures and reliable outcomes, ultimately setting the stage for informed decision-making.
- Analyze the Data: Employ statistical techniques and analytical tools to uncover patterns, trends, and insights. Utilize software such as Excel, Tableau, or specialized analytics platforms to facilitate this critical process of turning data into information, which enables you to make data-driven conclusions.
- Visualize the Information: Create charts, graphs, and dashboards to present your findings visually. Effective visualization simplifies interpretation and enhances communication with stakeholders, particularly by turning data into information, making your data more accessible and actionable.
- Formulate Conclusions and Take Actions: Leverage your analysis to derive practical knowledge that can inform your marketing strategies and influence decision-making processes. By turning data into information, sales teams can significantly enhance their performance and achieve their objectives.

Utilize Tools and Resources for Data Processing
To effectively transform data into actionable insights, sales leaders must leverage key tools that drive results:
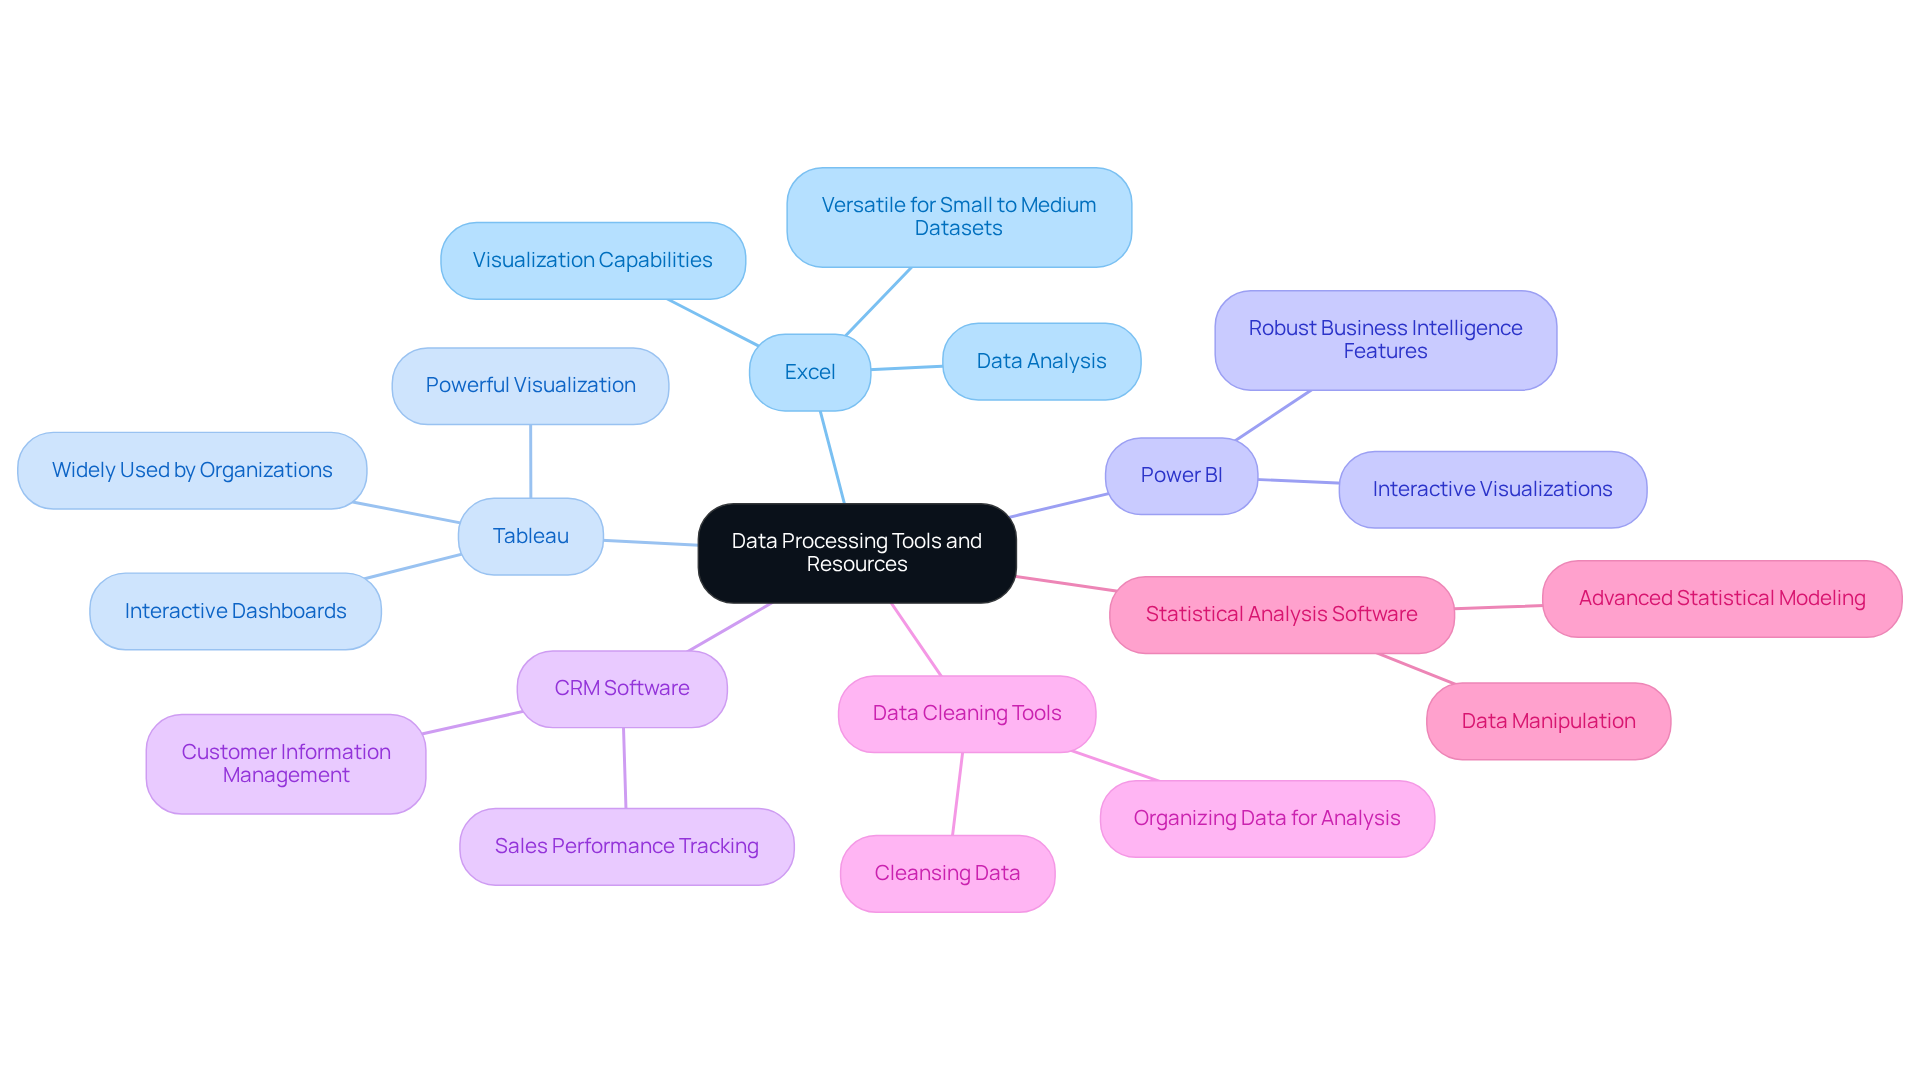
- Excel: This versatile tool is essential for data analysis and visualization, particularly suited for small to medium datasets. As Jim Barksdale aptly stated, "If we possess information, let’s examine the information. If all we have are opinions, let’s go with mine," underscoring the critical role of data-driven decision-making.
- Tableau: Renowned for its powerful information visualization capabilities, Tableau empowers users to create interactive and shareable dashboards. With over 120,000 organizations utilizing Tableau, it stands out as a preferred choice for teams striving to enhance their .
- Power BI: This business analytics tool offers interactive visualizations and robust business intelligence features, establishing itself as a formidable option for sales performance analysis.
- CRM Software: Platforms such as Salesforce and HubSpot are indispensable for managing customer information and tracking sales performance, providing insights that can influence strategic decisions.
- Data Cleaning Tools: Software like OpenRefine is crucial for cleansing and organizing data prior to analysis, ensuring that the insights derived are based on accurate details.
- Statistical Analysis Software: For more complex analysis tasks, resources such as R or Python libraries (Pandas, NumPy) can be employed, enabling advanced statistical modeling and data manipulation.
By employing these resources, sales executives can efficiently engage in turning data into information, which allows them to convert unrefined data into significant insights, leading to enhanced results and operational effectiveness. However, companies often face challenges such as poor data quality and resistance to change, highlighting the importance of utilizing these tools effectively.

Troubleshoot Common Data Transformation Issues
Common issues in turning data into information can significantly affect your business outcomes.
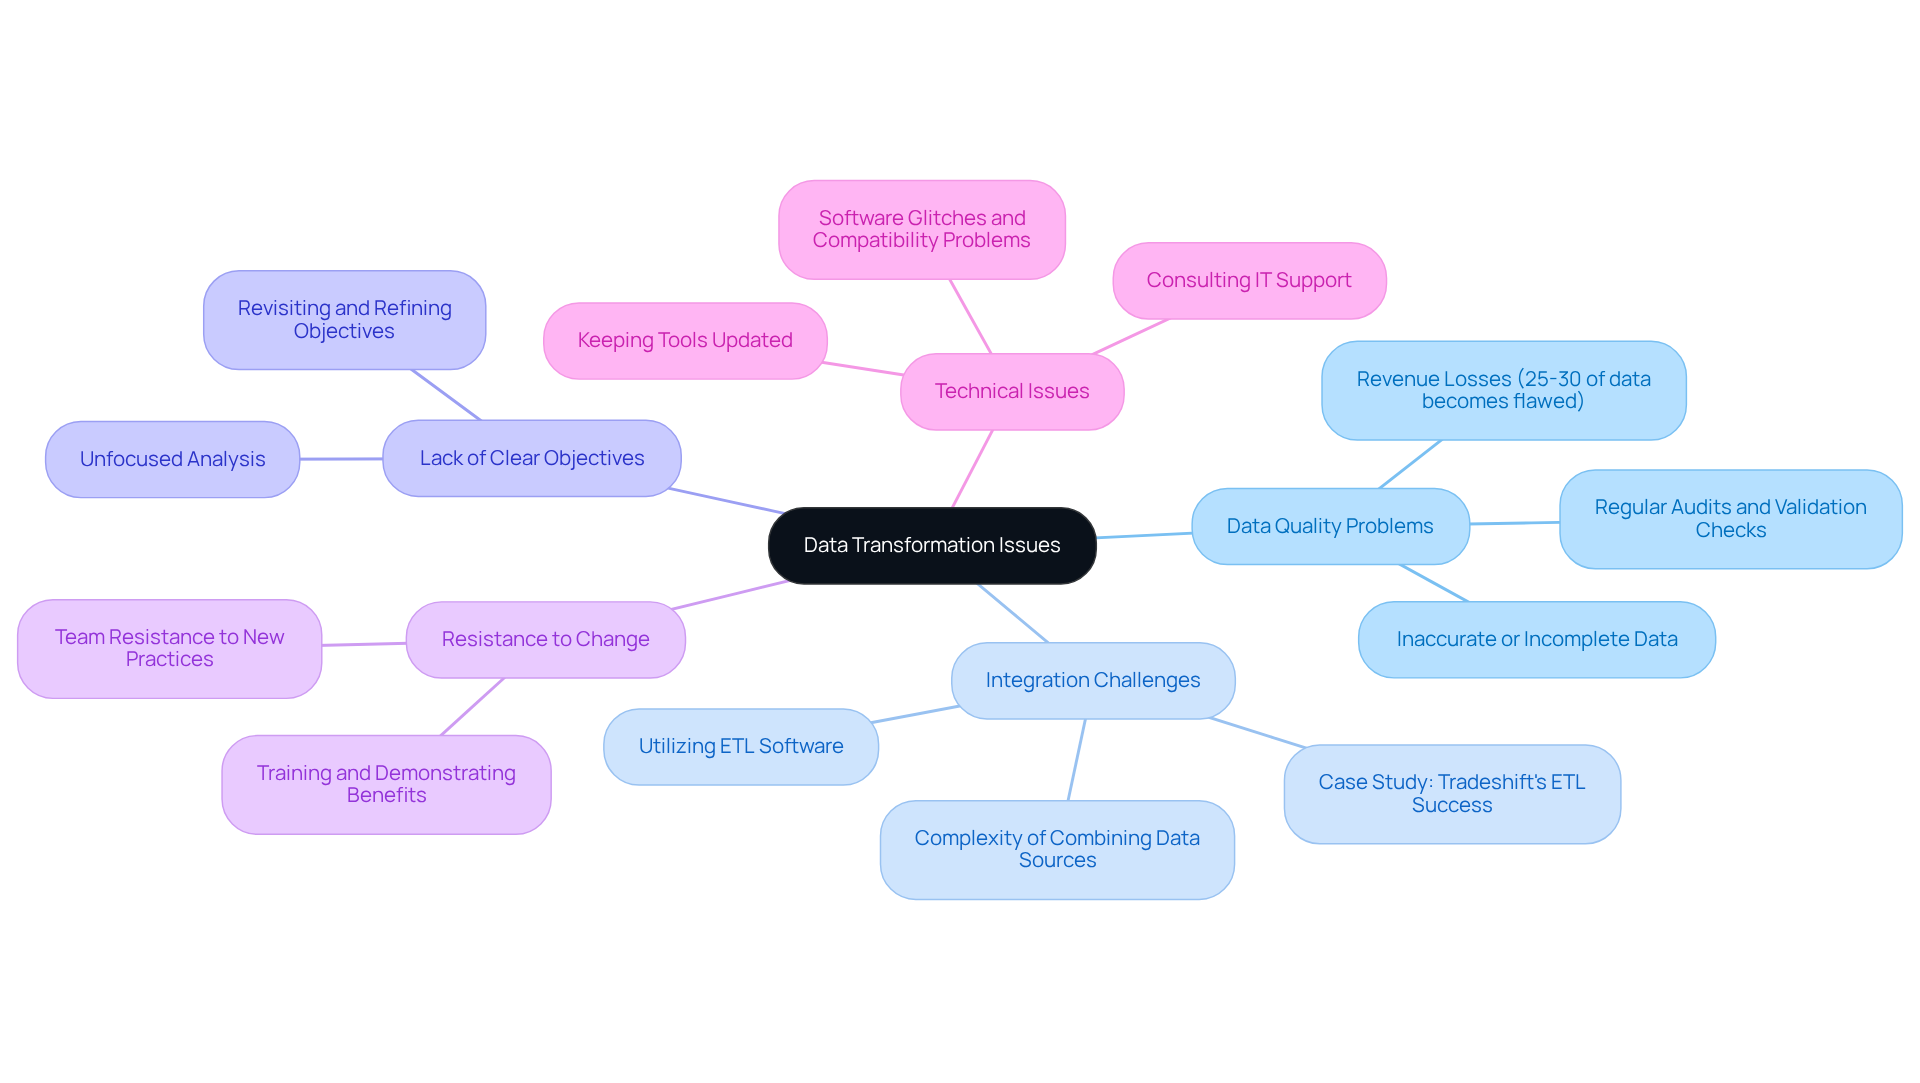
- Data Quality Problems: Inaccurate or incomplete data leads to misleading insights, which can severely affect sales strategies. Regular audits of information sources and the implementation of validation checks are essential for turning data into information that maintains high quality. Research indicates that approximately each year, potentially resulting in substantial revenue losses.
- Integration Challenges: The complexity of combining information from various sources often leads to inconsistencies. Utilizing ETL (Extract, Transform, Load) software can streamline this process by turning data into information and ensuring precise consolidation. For instance, firms like Tradeshift have effectively leveraged ETL tools to purify and enhance their data, achieving a tenfold increase in compliance and operational efficiency.
- Lack of Clear Objectives: Without well-defined goals, analysis can become unfocused, wasting valuable resources. By consistently revisiting and refining your objectives, you can ensure that your data efforts align with business needs, which is crucial for turning data into information that enhances the effectiveness of your sales strategies.
- Resistance to Change: Team members may resist new practices, which can hinder progress. Comprehensive training and demonstrating the tangible benefits of data-driven decision-making can foster a culture of acceptance, encouraging buy-in from all stakeholders.
- Technical Issues: Software glitches or compatibility problems can impede data processing and analysis. Keeping your tools updated and consulting IT support when necessary can alleviate these challenges, ensuring smooth data operations. Organizations that prioritize data quality and integration are better positioned to leverage insights effectively, turning data into information that drives improved sales outcomes.

Conclusion
Transforming raw data into actionable information is not just a process; it is a critical imperative for sales leaders who aspire to enhance decision-making and operational efficiency. By grasping the distinction between data and information, sales professionals can harness the power of analytics to drive meaningful insights and strategies that propel their organizations forward.
This article outlines a comprehensive approach to this transformation, detailing essential steps such as:
- Defining objectives
- Collecting relevant data
- Cleaning and organizing it
- Analyzing trends
- Visualizing results
- Ultimately taking informed actions
With powerful tools like Excel, Tableau, and CRM software at their disposal, sales leaders can effectively navigate the complexities of data processing while addressing common challenges such as data quality issues and resistance to change.
The significance of turning data into information cannot be overstated. As organizations increasingly rely on data-driven decision-making, embracing these processes and tools will not only enhance sales performance but also foster a culture of continuous improvement. By prioritizing the transformation of data into actionable insights, sales leaders can position their teams for success in an ever-evolving marketplace.
Frequently Asked Questions
What is the difference between data and information?
Data consists of raw, unprocessed facts and figures, such as numbers, dates, and text, which lack context and meaning. Information, on the other hand, is data that has been processed, organized, or structured to provide context and meaning, allowing for insights and understanding.
Why is turning data into information important?
Turning data into information is essential for generating reliable insights, which are foundational for effective decision-making and operational efficiency. It helps organizations derive meaningful insights that can inform strategies and actions.
What percentage of analytics professionals prioritize evidence-based decision-making?
A survey revealed that 77% of analytics professionals prioritize evidence-based decision-making, highlighting the importance of transforming data into information for meaningful insights.
What is the significance of unused organizational information?
Alarmingly, 90% of organizational information often remains unused, representing a significant untapped resource that could be leveraged to turn data into information and generate actionable insights.
Can you provide an example of how businesses use information to adapt strategies?
Businesses that analyze revenue information over time can identify growth trends, such as a commercial group correlating revenue figures with marketing expenditures to assess the impact of promotions and refine future campaigns.
How is automation expected to impact data-driven decision-making by 2025?
Gartner's research predicts that by 2025, nearly all data-driven decisions will incorporate some level of automation, driven by AI and decision intelligence, emphasizing the need for effective management of information by sales leaders.
What is the relationship between information and knowledge?
Information serves as the foundation for knowledge, which represents the actionable understanding derived from processed information. Recognizing this distinction is vital for gaining a competitive edge in decision-making.


